My friend Chris Peel recently did a deep dive into US Federal income tax schedules. He computed effective tax rates by inflation-adjusted income for years 1862 to 2024, taking into account the standard deduction. I thought it'd be fun to visualize his results, and it's proven to be an interesting exercise.
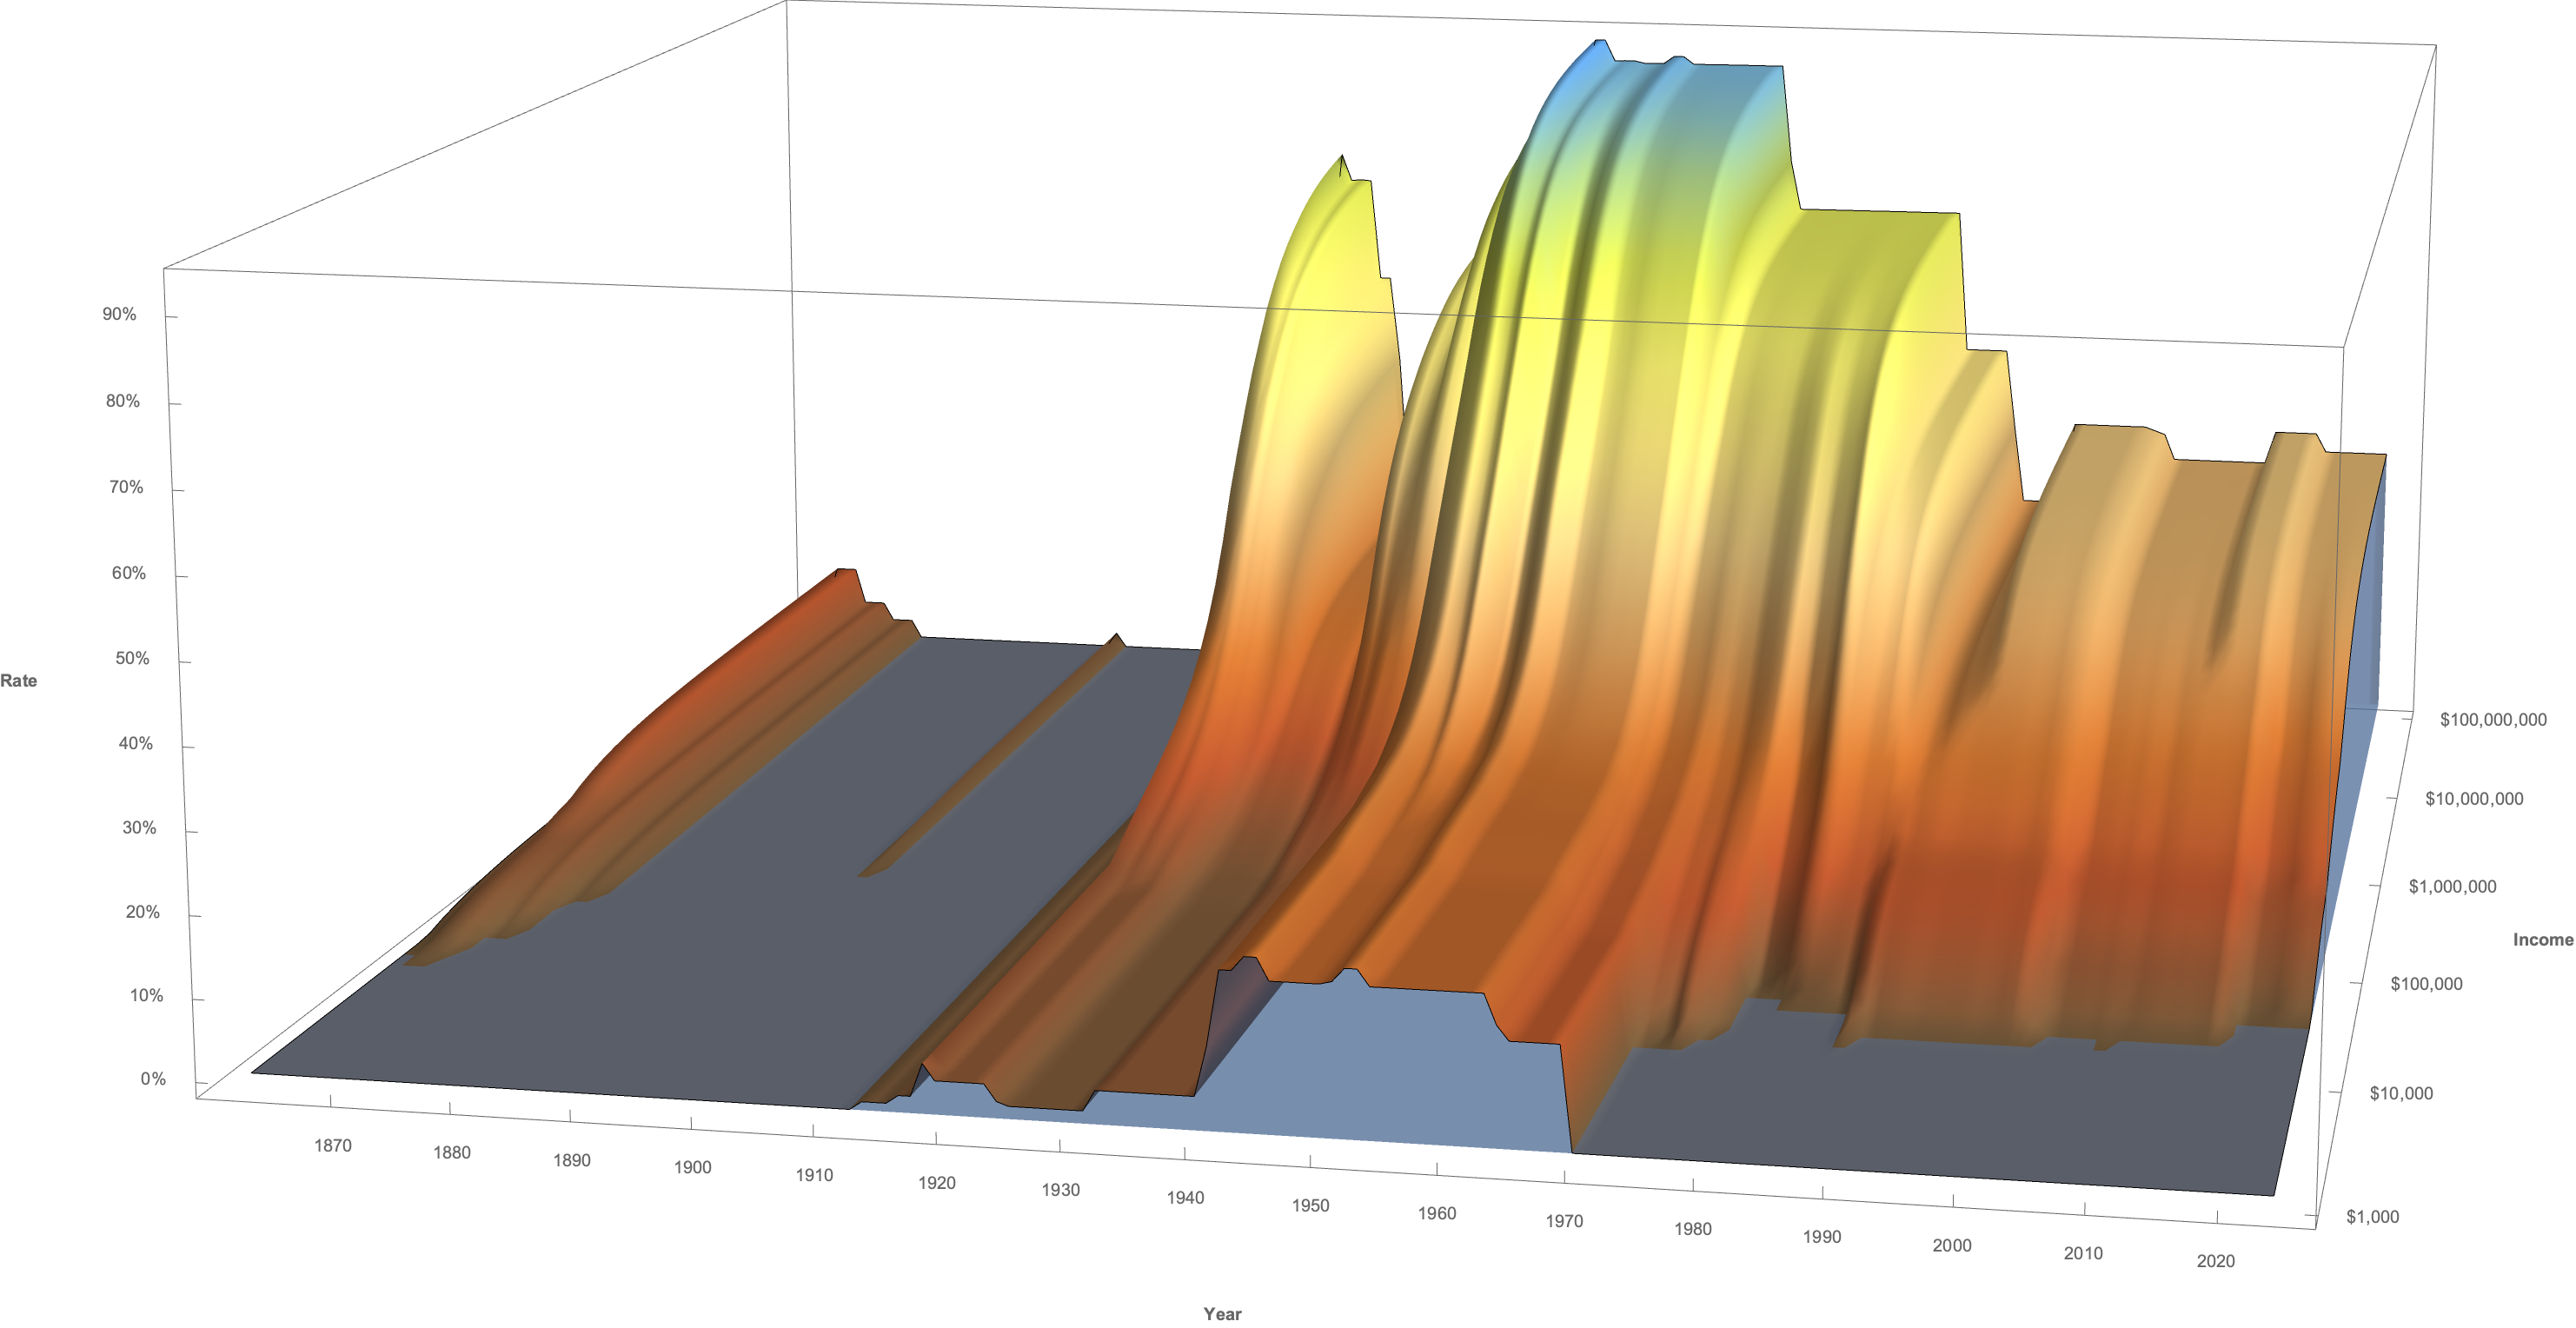
First, here's the full history of effective US tax rates as a single surface.
Click for a larger view! Or play with an interactive version online!
Our data is rates for married households, filing jointly. The numbers are computed from ordinary income rates only, so they will be overstated for high-income households, who enjoy a great deal of tax-advantaged capital income. All dollar amounts are CPI-adjusted 2024 dollars.
What stood out immediately to me in this graph is the constancy at the middle. Since the World War II peak, rates have collapsed at the high end and at the low end. At middle incomes? Not so much.
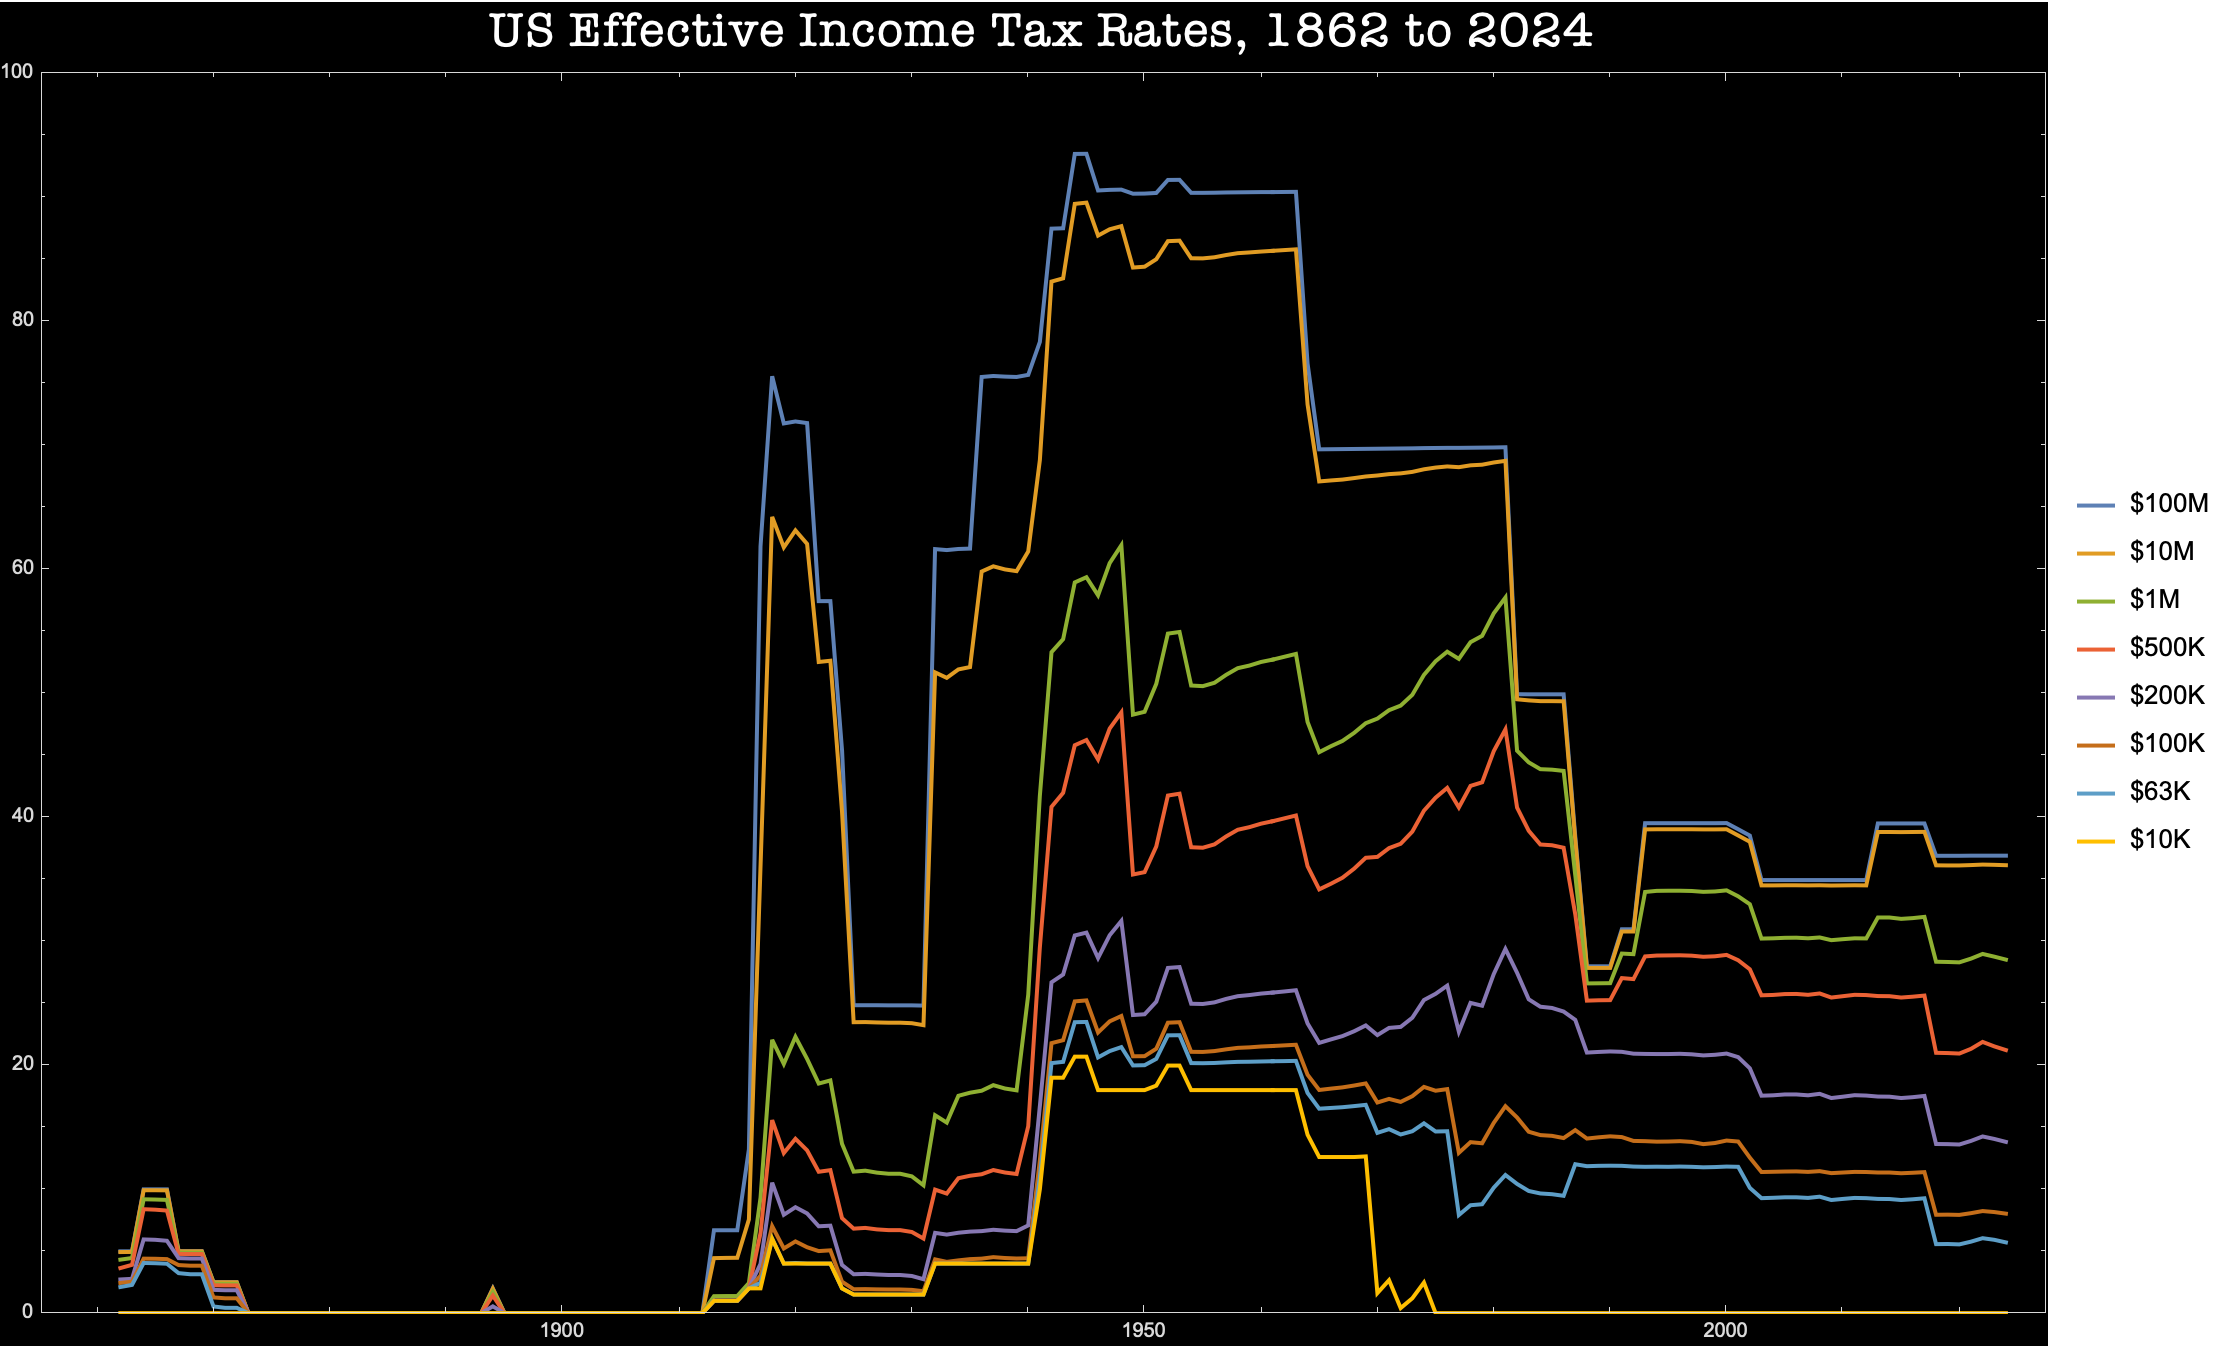
Let's take a look at the same information as cross-sections by income.
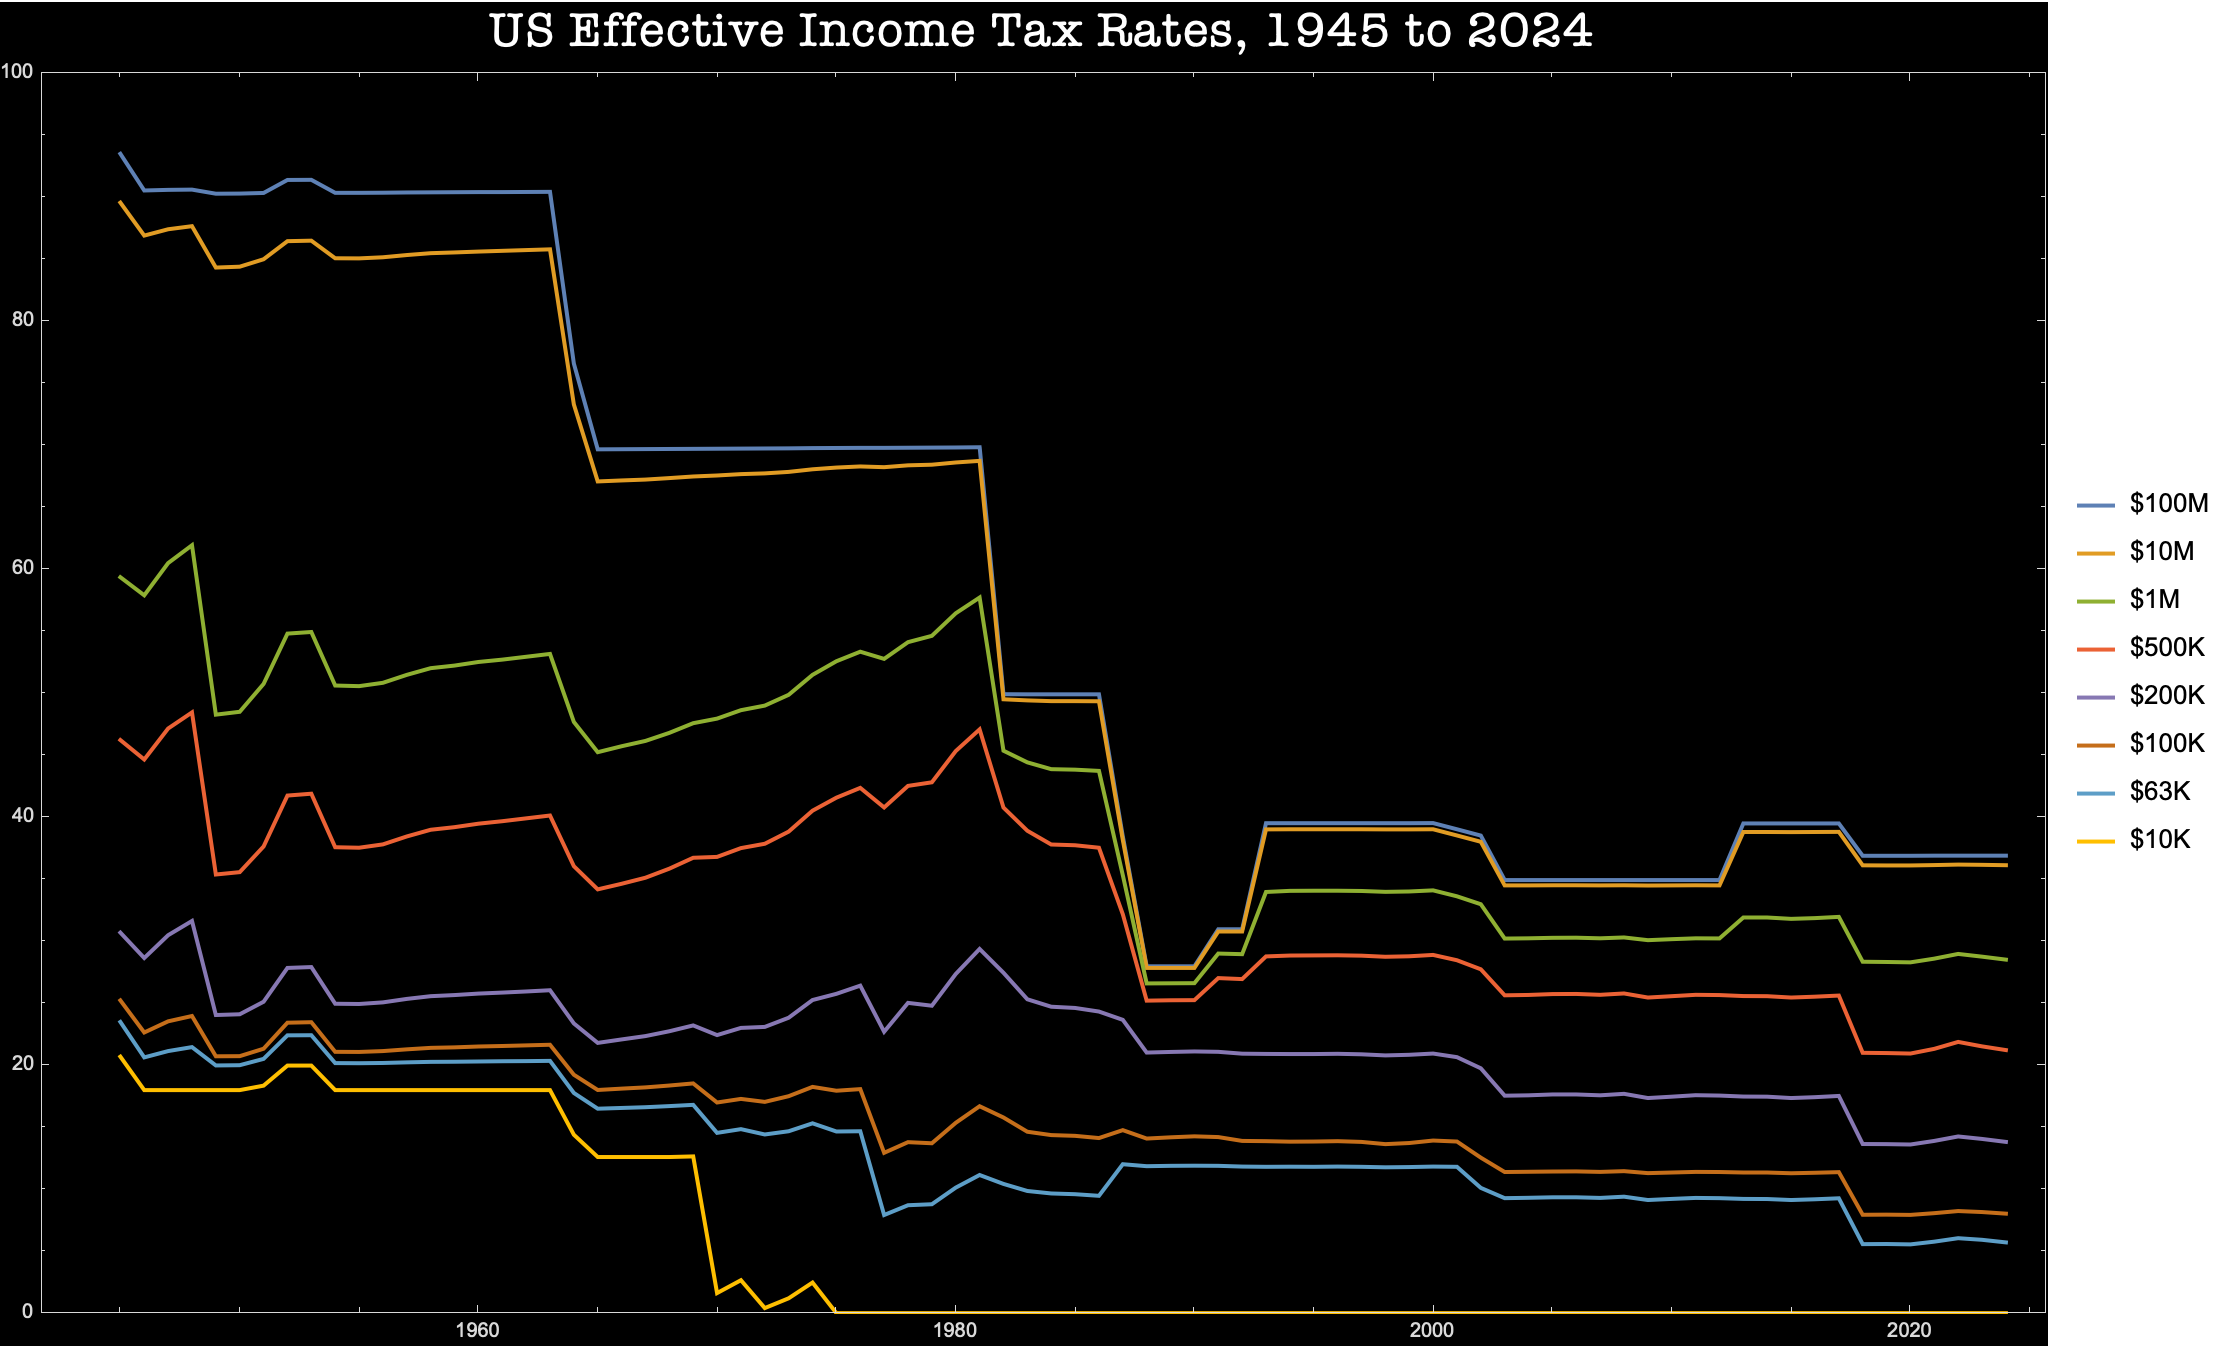
Now let's zoom into the post-war period. We'll begin in 1945, when the US had its highest income tax rates, from which they have subsequently collapsed.
I think it's helpful to divide this picture into four categories:
- Ultra high income: income ($10M, $100M)
- High income: ($500K, $1M)
- Middle income: ($63K, $100K, $200K)
- Low income: $10K
(As of 2022, the median income for married couples was about $109,000. Assuming, conservatively, it has remained constant in inflation-adjusted terms, that would be $115,000 dollars today. Real median income has grown over time, and we'll want to encompass a bit above the median, so we let the range from $63K to $200K 2024 dollars represent our "middle".)
The first lesson here is that income tax policy has been least important for the middle-income group. There's just a lot less variation at $63K, $100K, and $200K levels than at levels above and below.
| Income | Min | Max | Range (%-pts) | σ |
|---|---|---|---|---|
| $100M | 28% | 94% | 66 | 22.93 |
| $10M | 28% | 90% | 62 | 21.28 |
| $1M | 27% | 62% | 35 | 10.81 |
| $500K | 21% | 48% | 28 | 7.66 |
| $200K | 14% | 32% | 18 | 4.36 |
| $100K | 8% | 25% | 17 | 4.55 |
| $63K | 6% | 24% | 18 | 5.03 |
| $10K | 0% | 21% | 21 | 8.02 |
Data restricted to the period 1945 - 2024. Rates and ranges are rounded to whole numbers. Apparent miscalculation of the range at 500K is a rounding artifact.
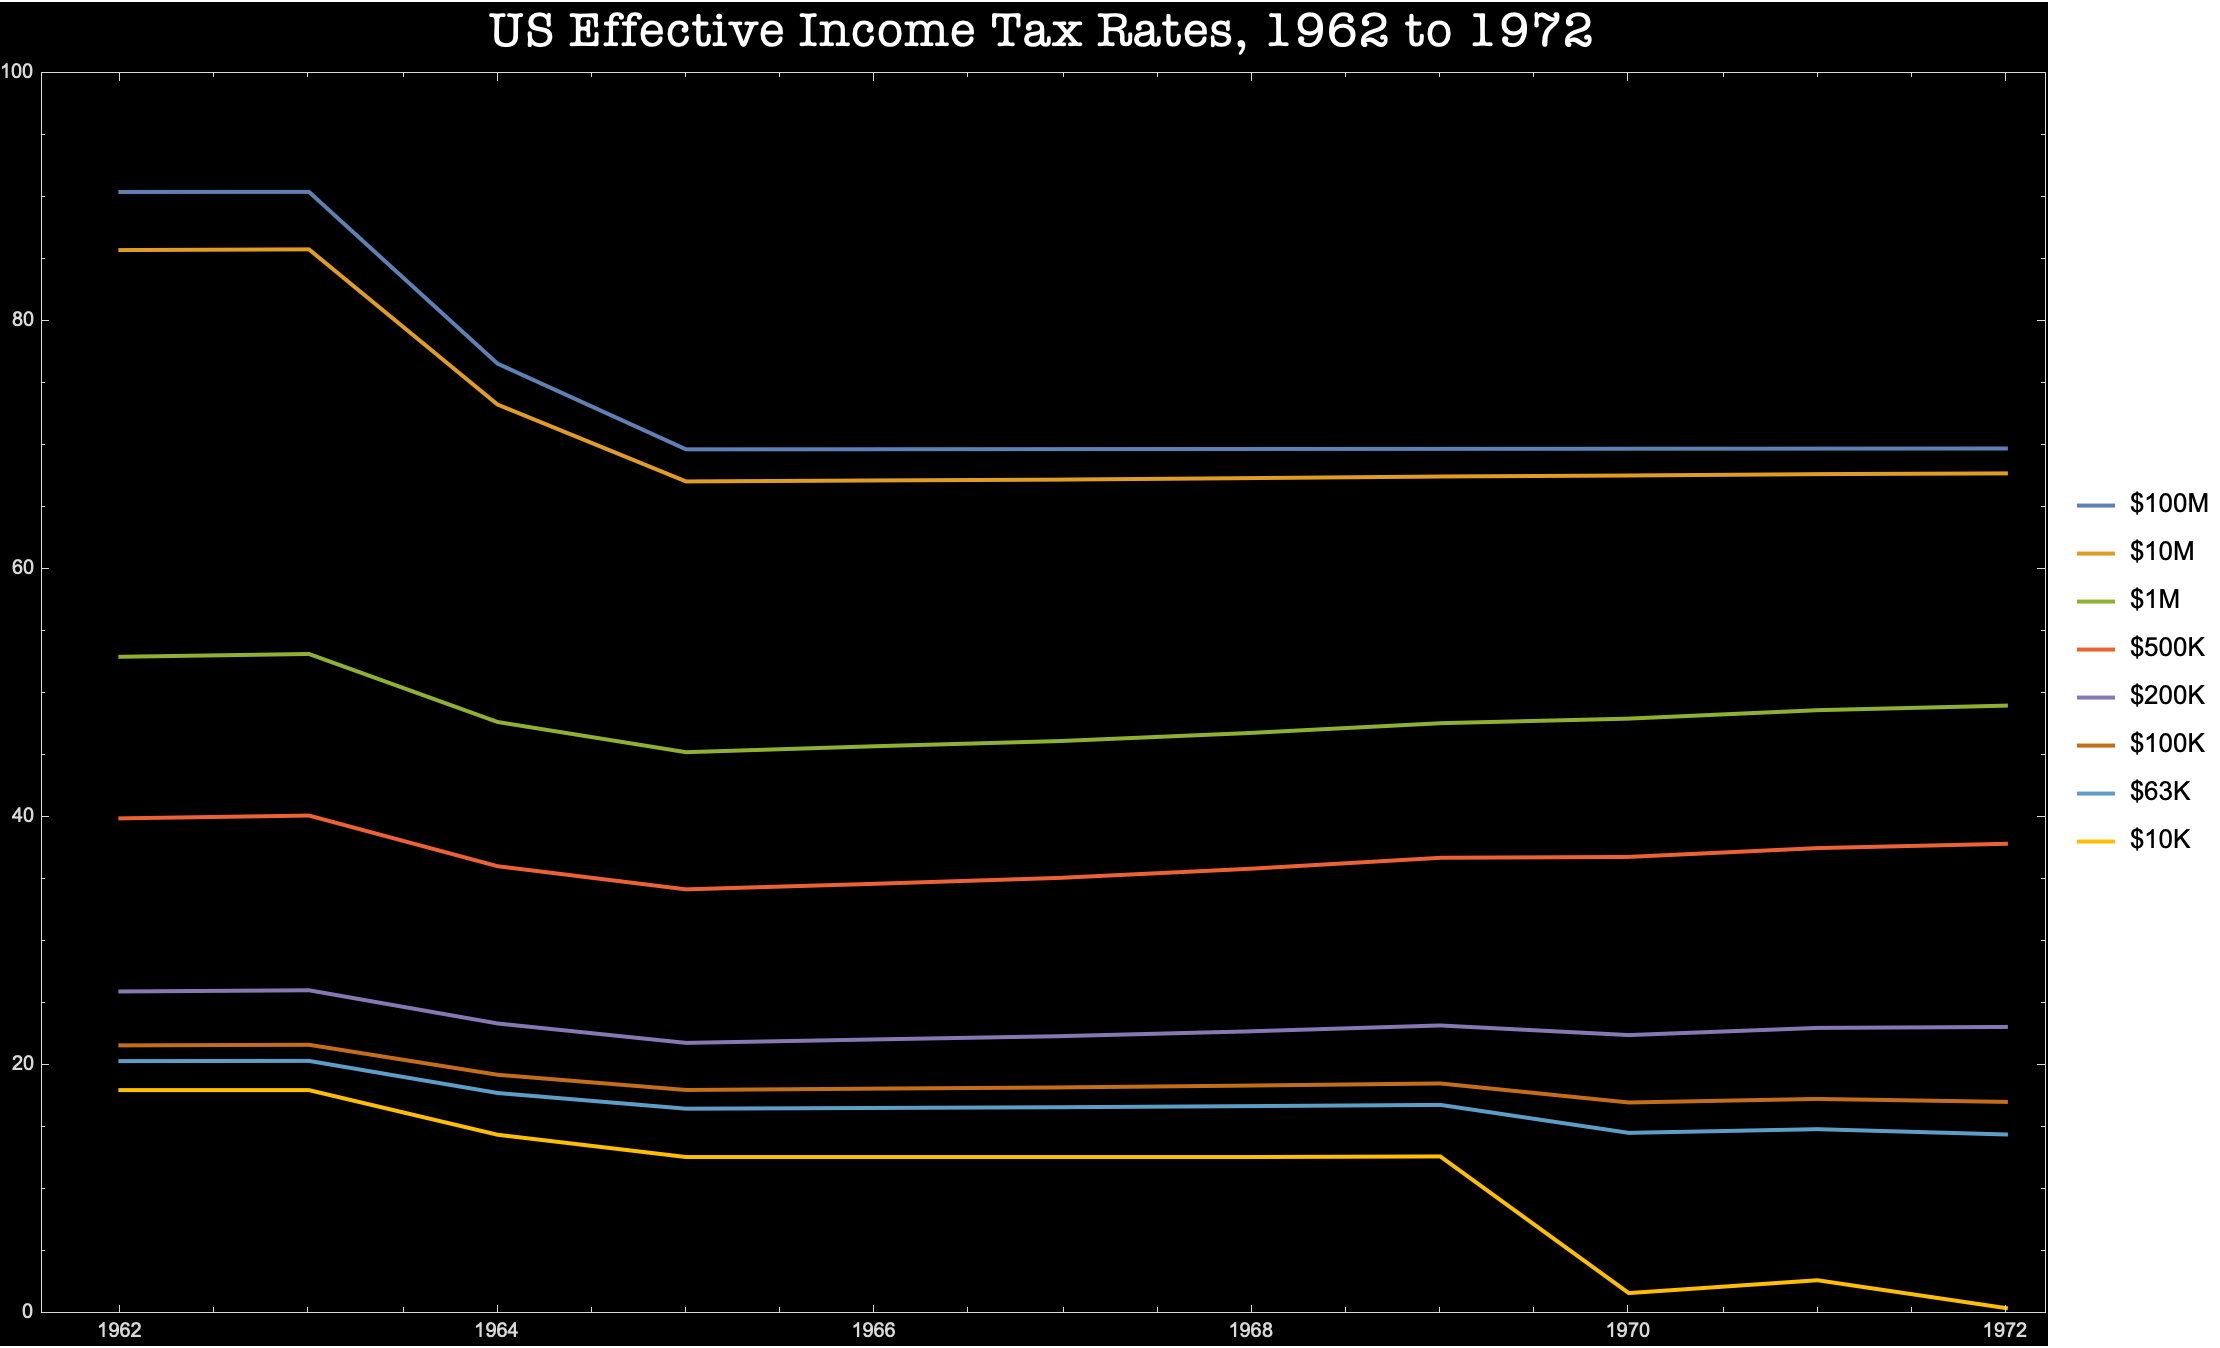
From 1944-1969 the standard deduction was defined as 10% of income to a maximum of $1000. That meant that, then and now, the standard deduction did very little for high-income earners. But before 1970, it also did very little for low-income earners. In 1970, the standard deduction became defined as a fixed amount, which meant that people with very low incomes could deduct everything. A fixed-amount standard deduction renders the effective income tax very progressive at low incomes, but its influence fades as incomes rise.
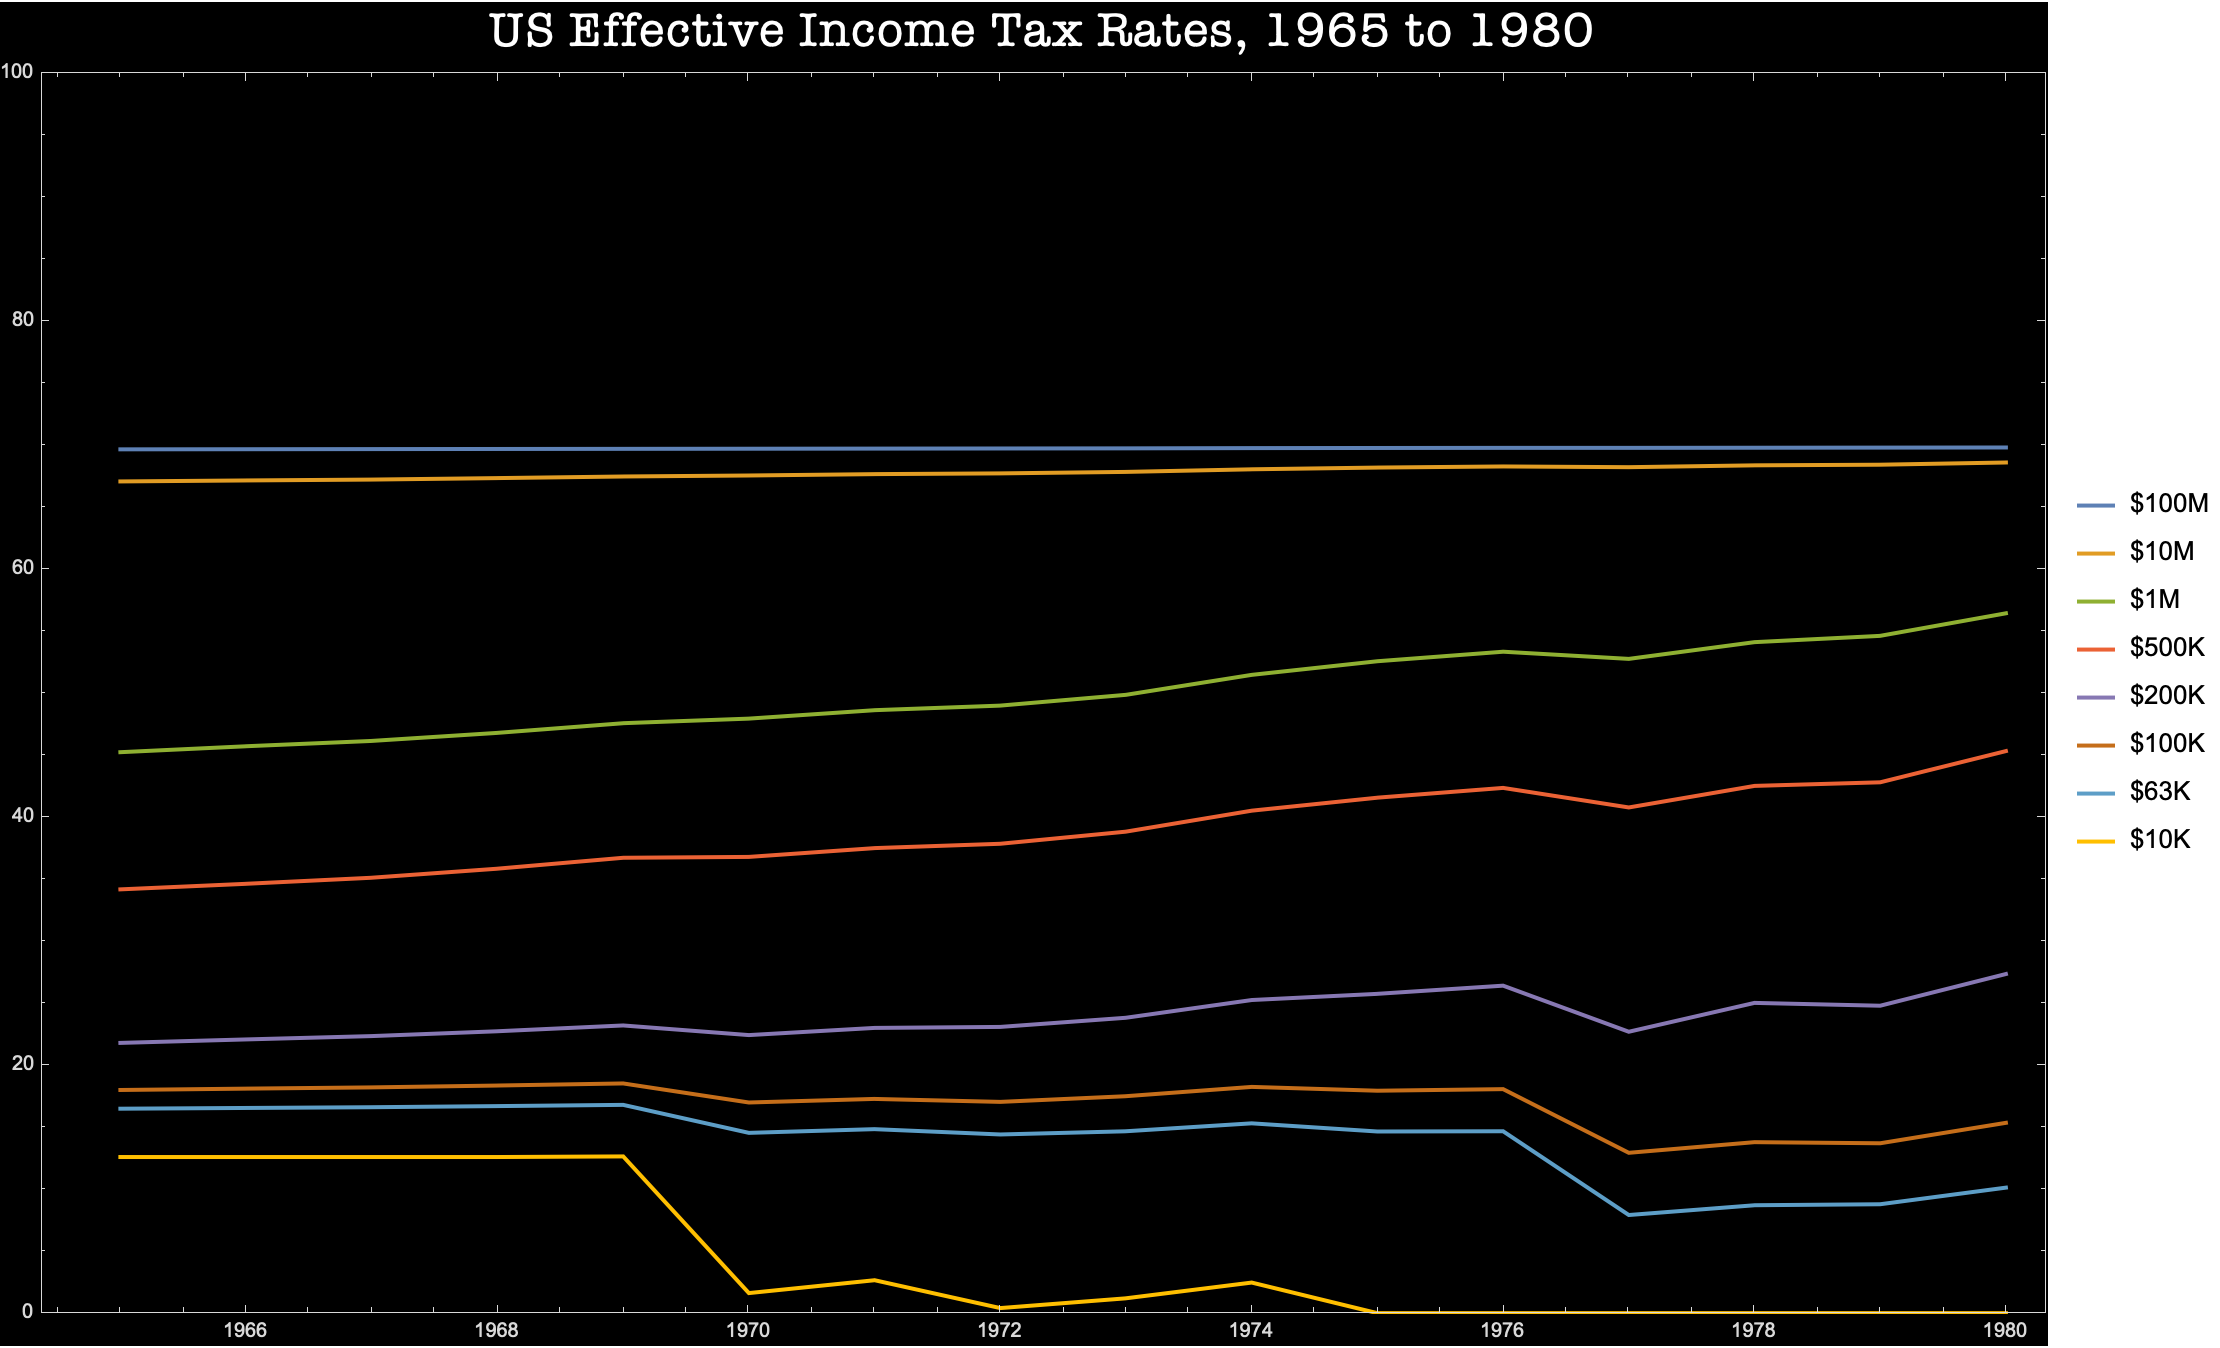
A third lesson is just how terrible JFK's tax cuts were, for those of us who believe that democracy and a decent society depend upon preventing plutocratic wealth accumulation. Between 1963 and 1965, effective tax rates paid by $100M earners dropped by 20 percentage points, while a middle-income earner making $100K (in 2024 dollars) saw relief of 4 to 5 percentage points.
A fourth lesson is that the period 1965 to 1980 was a political economy catastrophe. There were no tax increases on ultra-high-income earners during the period, but ordinary high-income earners saw their tax burden steadily rise.
Ordinary high-income earners represent a very important group of people. They are most successful professionals, influential in society and much more numerous than ultra-high-income earners. This is the group that actually peoples the commanding heights of the economy and the media. Raising taxes on this group while holding plutocratic earners harmless was a terrible own goal. It delivered very little of the main benefit of progressive taxation (preventing plutocratic wealth accumulation!) while it sewed the seeds for a tax revolt.
The tax policy of this period was not calibrated to win the hearts and minds of middle-income earners. Lower-middle-income earners did enjoy some tax relief, but upper-middle-income earners endured increases, the middle-middle was basically flat. I suspect the dumb policy was motivated fiscal revenue accounting. Increasing rates on high-income earners delivers revenue, while ultra-high-income earners avoided their much higher taxes by not realizing personal income.
But financing the government is not about revenue in accounting terms. It depends on the disinflationary impulse that taxation provokes. Taxing high earners is less disinflationary, serves to finance spending less effectively, than taxing people lower in the income scale. Because affluent people's marginal dollar of income is usually saved rather than spent, taxing it does not reduce spending. So the additional revenue was largely fruitless. The additional resentment, however, made fertile ground from which a terrible flower would soon blossom.
Billionaire politics is about making human shields of the merely affluent.
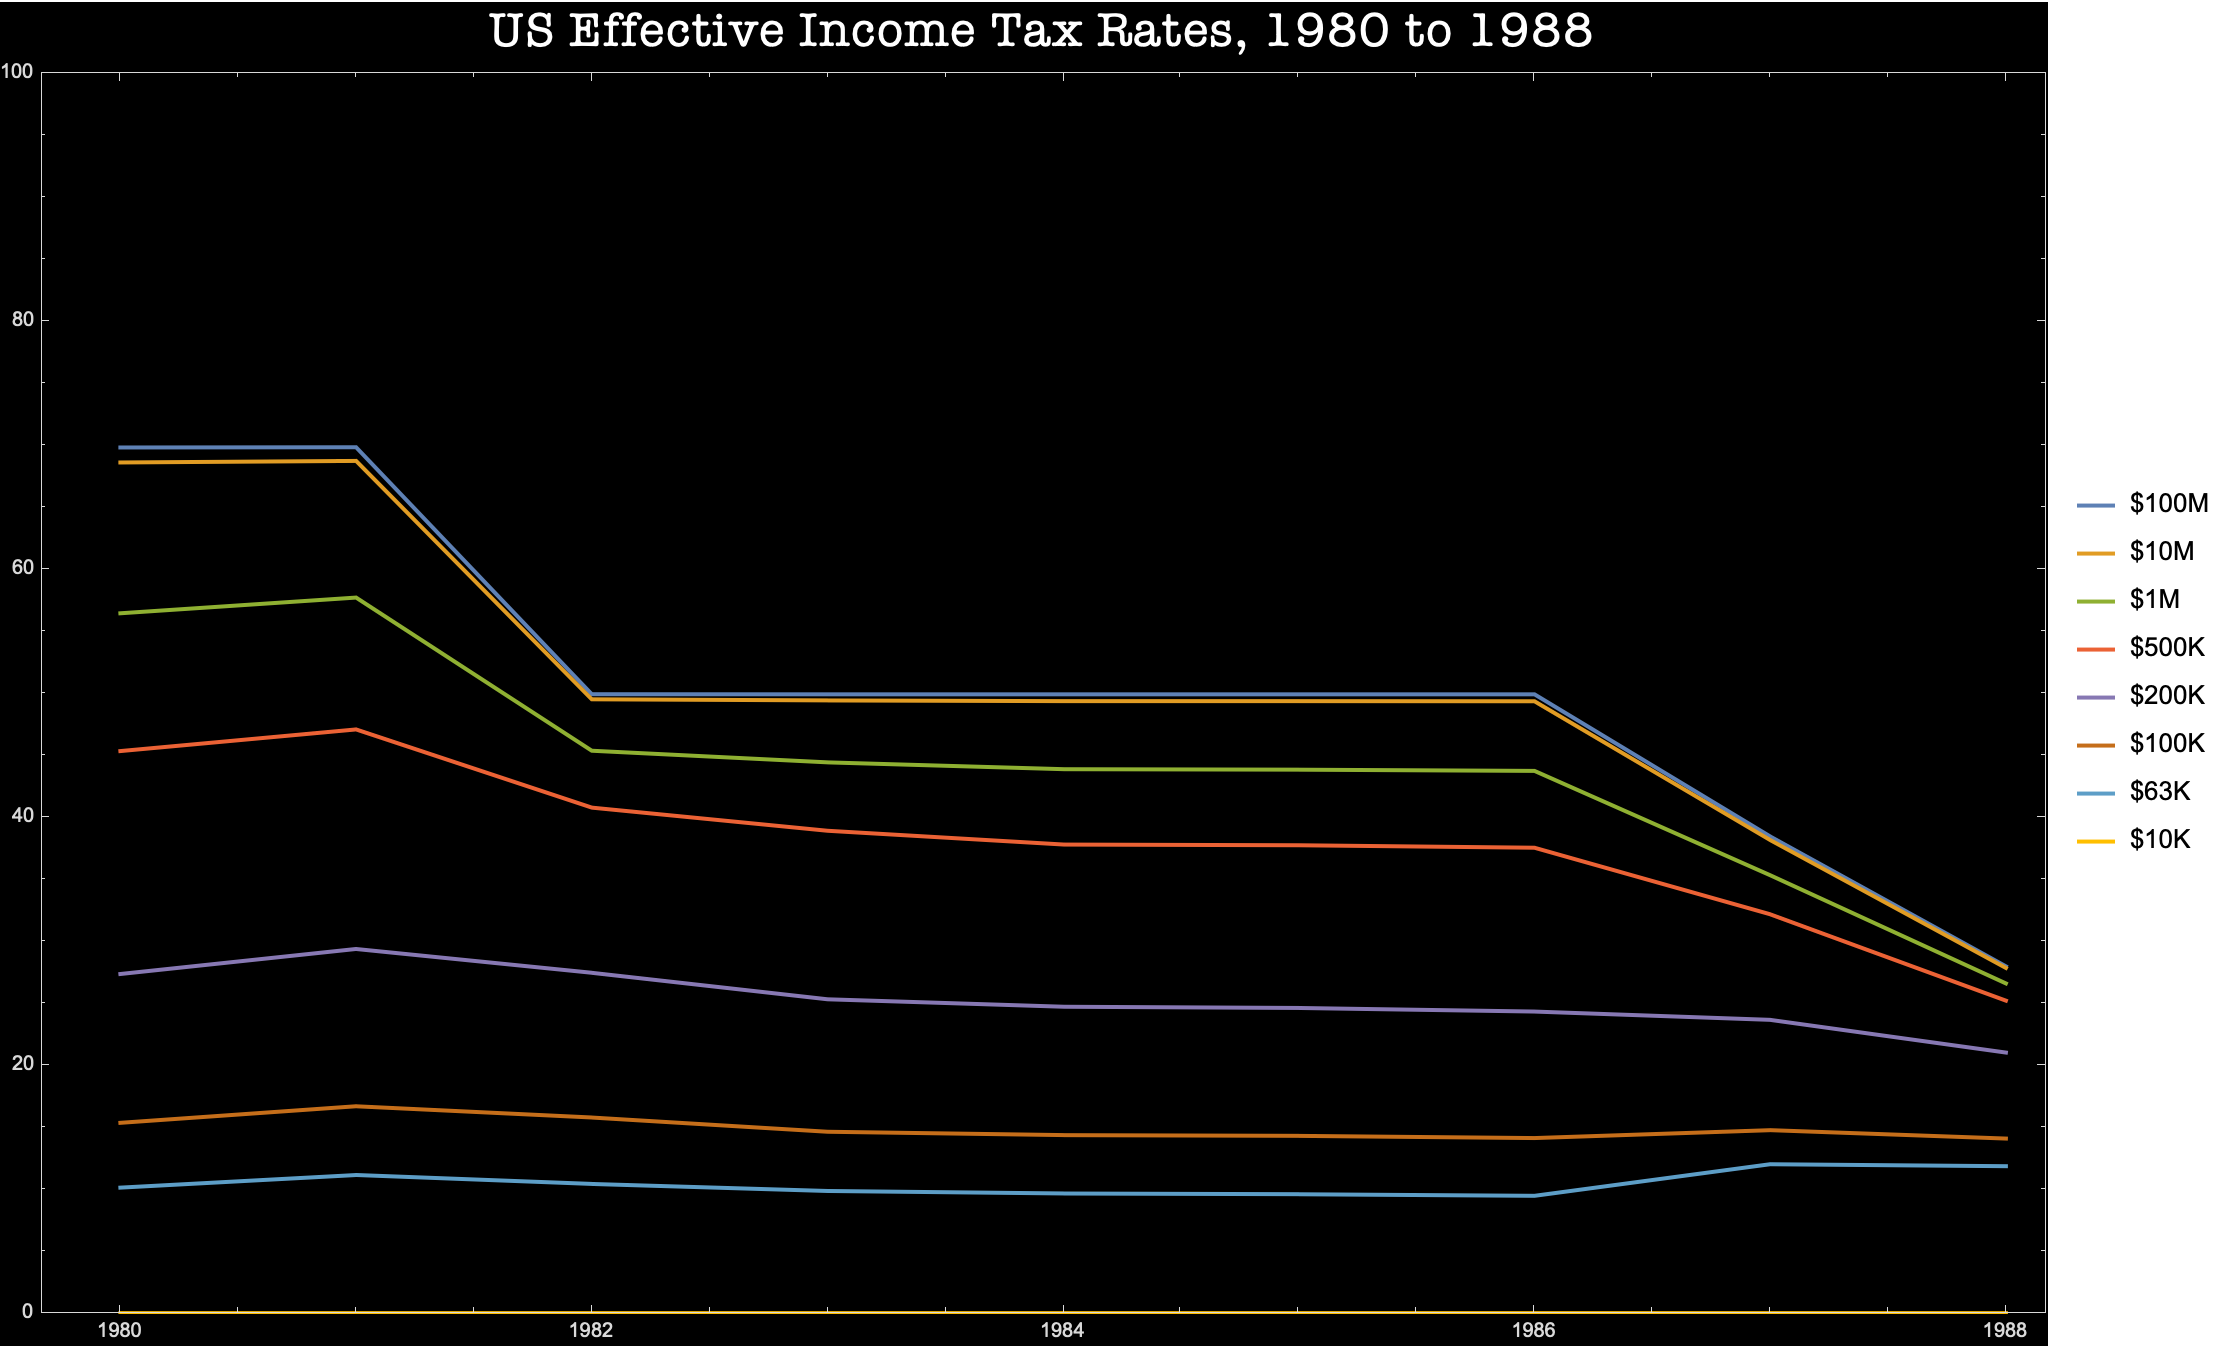
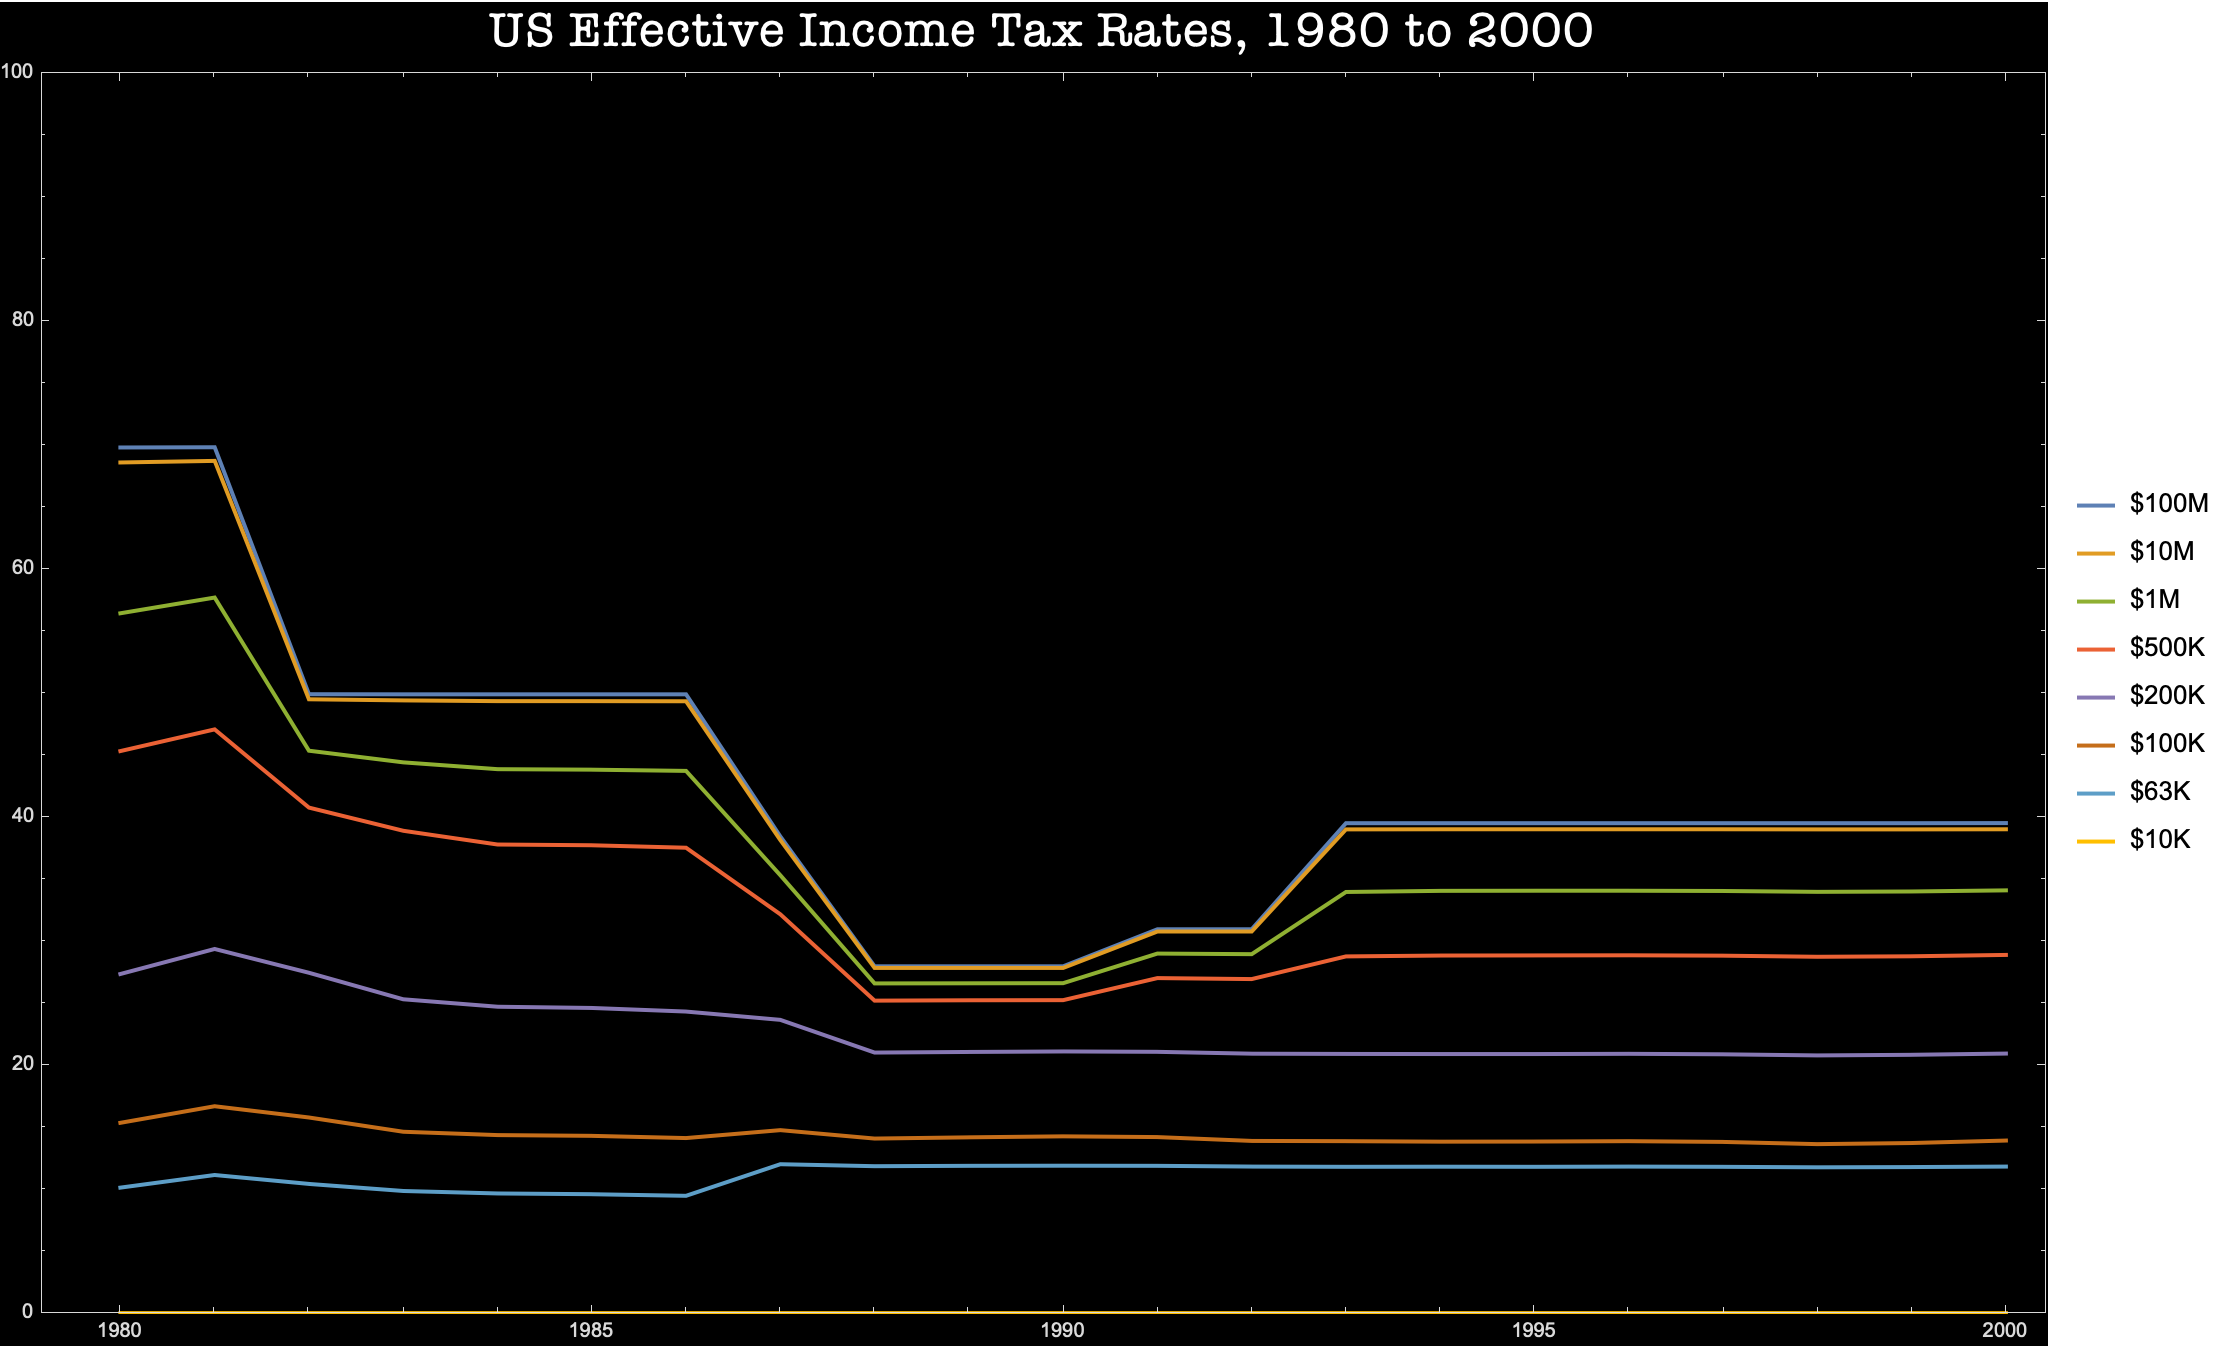
A fifth lesson is that Ronald Reagan's tax policy was horrendous, and is largely still with us today.
Those high-income earners who had grown resentful of their tax burden, which had been steadily increasing since the mid-sixties? They finally got their, um, retribution. Ultra-high-income earners, who had suffered no increase at all, hitched a ride on this tax revolution by affluent professionals and won the biggest rate cuts of all.
Meanwhile lower-middle-income earners saw their rates rise over the period. What the fuck was the matter with Kansas?
George H.W. Bush and Bill Clinton undid only about a quarter of the damage Reagan had done. Not to mention JFK.
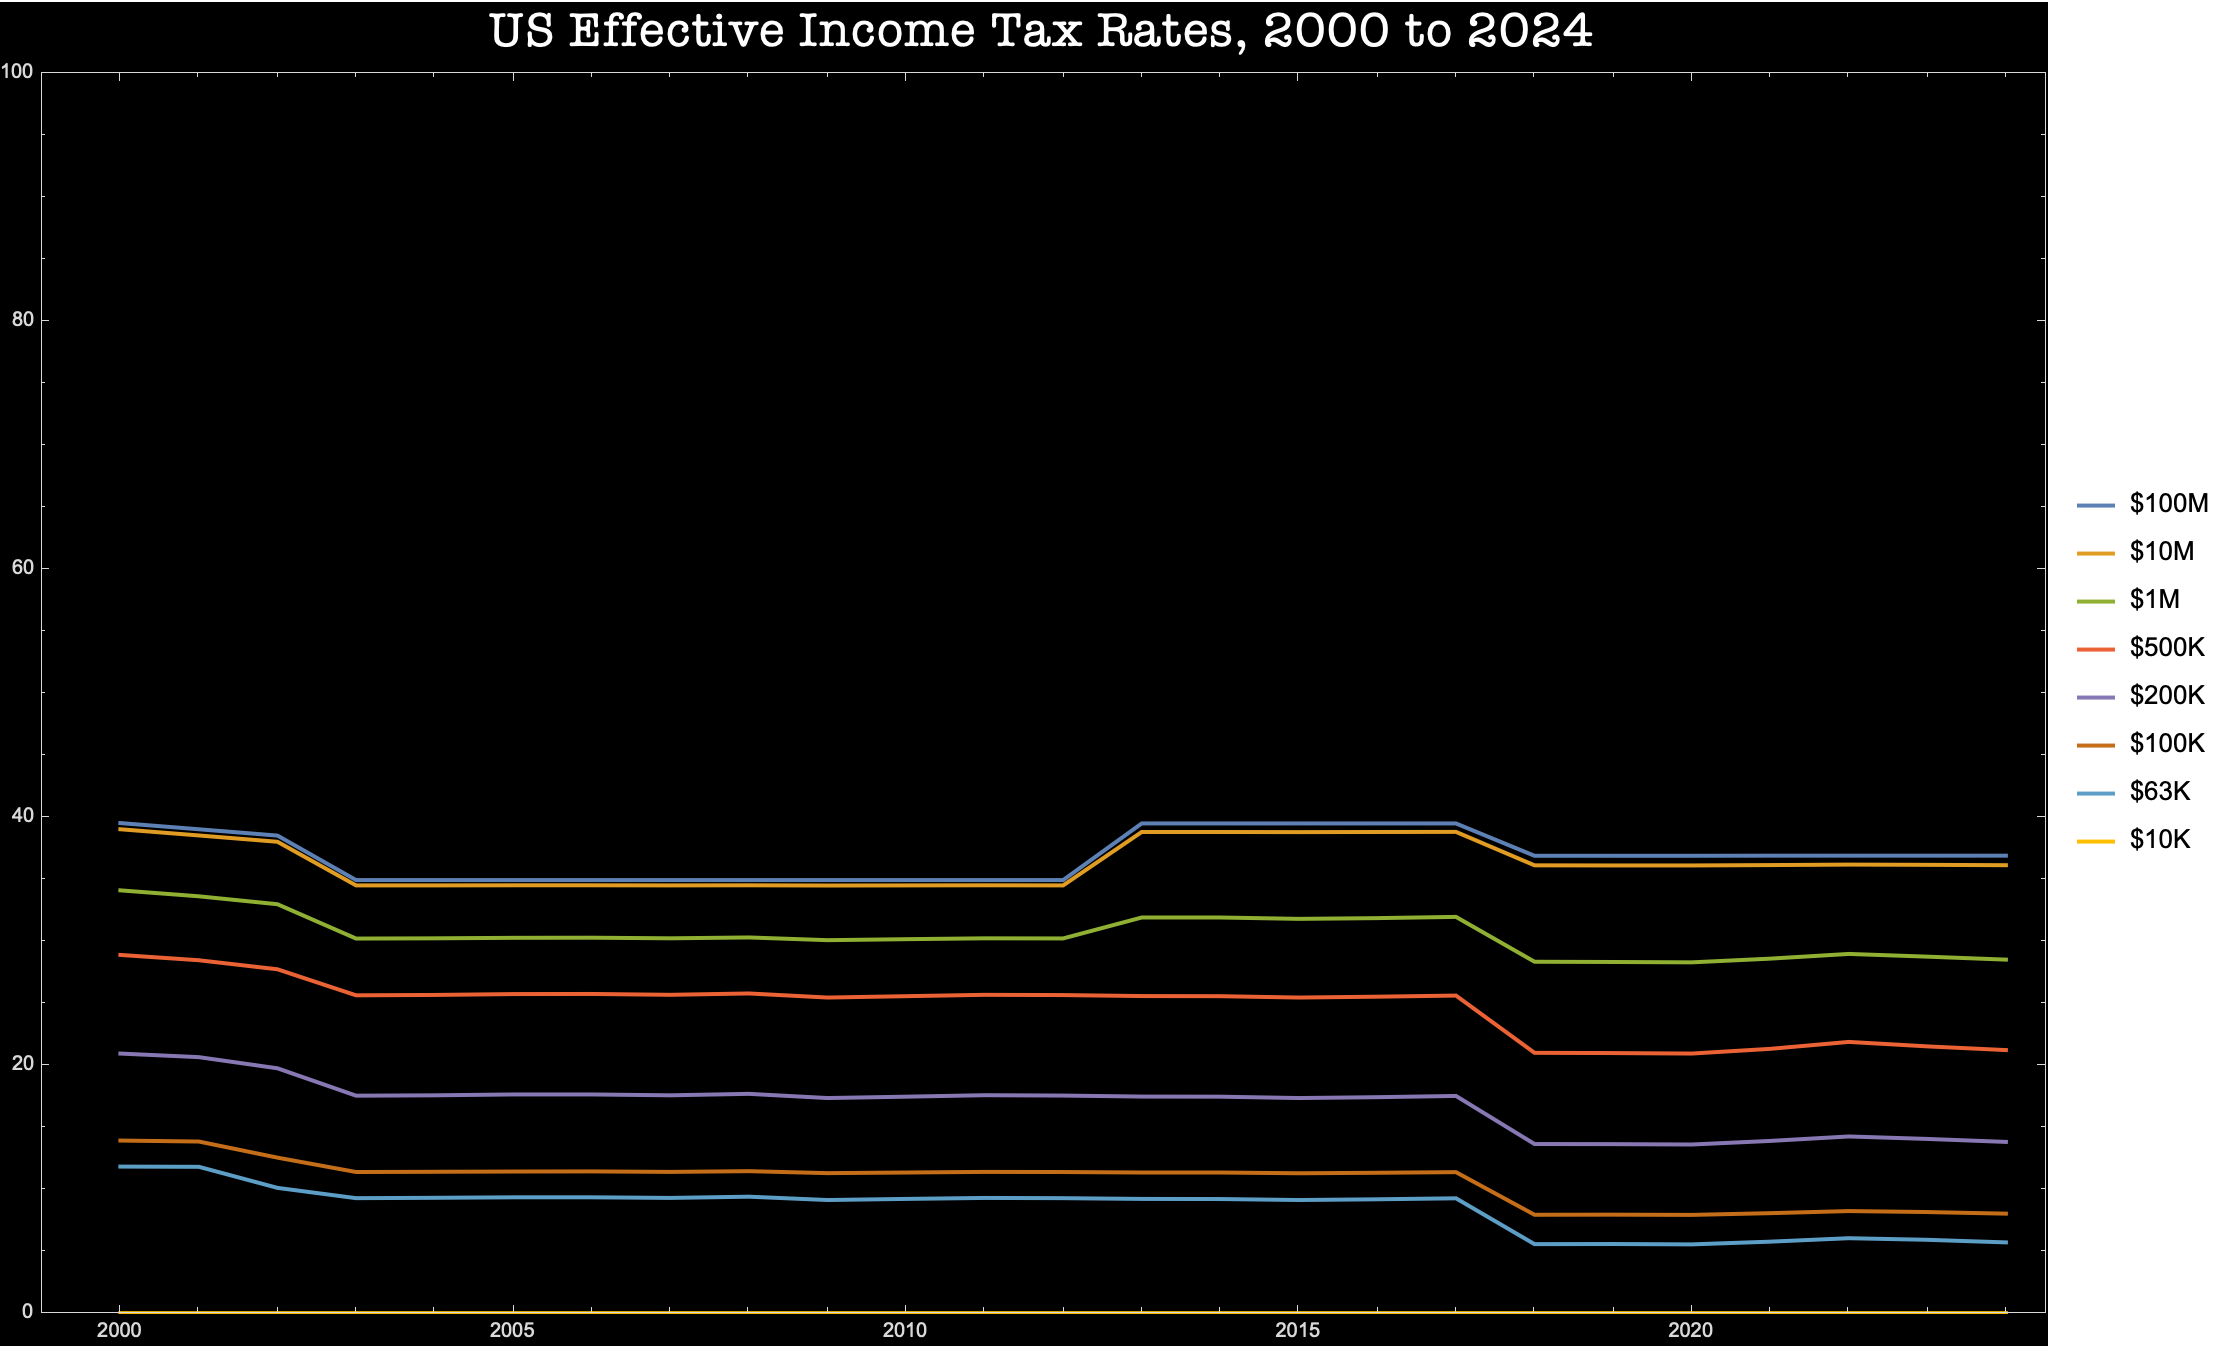
And that is the world in which we continue to live. Post Y2K, rates fluctuate, but rates on ultra-high-income earners have basically been flat.
Middle income rates rarely move much. But grading on a curve, cosidering the narrow range over which middle income rates do fluctuate, the tax cuts under George W. Bush and Trump did yield middle income tax relief. This relief has stuck, as only high and ulta-high income rates reverted under Obama, and nothing much has changed over Biden.
While I'm sure it's true, in dollar terms, that the overwhelming majority of the 2017 tax cuts go to very high earners, Trump, unlike Ronald Reagan, did actually deliver at least a little to people at middle incomes.
(Low income effective rates have been flat at zero throught the period. If you are wondering where the $10K line is, it may be hidden by the x-axis.)
Pulling back, the overarching story is simple:
Since World War II, US Federal income tax rates have fallen at every level. At middle incomes, they've deflated only modestly. But under the Kennedy and Reagan administrations, rates on ultra-high-income earners were demolished, in acts of social vandalism that have yet to be undone.
By throwing just a few small chicken bones to higher-income professionals and the middle class, mad occultists opened a portal to resurgent plutocracy. You can feel its dark wings thumping. We are living with the consequences.
Perhaps it's time we reseal the portal.
Appendix: If you'd like to reproduce my tables and graphs, see this Mathematica notebook (or as a PDF). The data is here. Or go straigh to the source, mfj.csv in Chris Peel's git repository. Chris' repository also includes animations of our evolving tax schedules. Chris based his calculations on data from the Tax Foundation.
2024-06-03 @ 03:55 PM EDT
